What are the must-have social media marketing statistics?
Social media can have a huge impact on most businesses. But exactly how big?
Today, you get the most important social media statistics in 2022 to determine where your audience hangs out, how you can reach them, and how you can turn them into loyal fans and paying customers.
Let’s dive right in.
Social Media Buyer Behavior Statistics
How social media can make all the difference
Why exactly is social media so important? Simple, because 5 billion people use the internet, out of which 4.65 billion are active social media users. (Statista)
I myself grew my business with social media. And countless other people have done the same.
Social media is a place where you reach your target audience more effectively than ever before. With a few clicks, you can talk to them in Facebook groups, send an Instagram Live, or use attractive pins to get people to click-through to your website.
But how many people buy on social media? What increases (or decreases) engagement on social media? What works and what doesn’t?
Here are the most important social media marketing statistics you need to know right now.
(By the way, don’t miss my guide on how to use social media for business.)
Facebook Statistics
First up: Facebook statistics. If you’ve been wondering who uses Facebook, how to create ads that work for the platform, or how to increase engagement, here you go. These statistics and data-driven studies show you what works and what doesn’t on Facebook.
- There are 2.7 billion active Facebook users worldwide in 2020. (Statista)
- Most users are in India, the United States, and Indonesia, followed by Brazil, Mexico, and the Philippines. (Facebook)
- 44% of users are women and 56% are men. (Facebook)
- The biggest user group is between 25-34 years old (32%). 18-24-year olds account for 23% of users, 35-44-year olds make up 19% of users, and 12#% of users are 45-54. 8% are 55-64 and 6% are 65+. (Facebook)
- In the US, the fastest-growing user group is people aged 50-64. (Gallup)
- 80% of Facebook users use it only on their mobile devices. 19% use it on their mobile and desktop and 2% use desktop only. (Facebook)
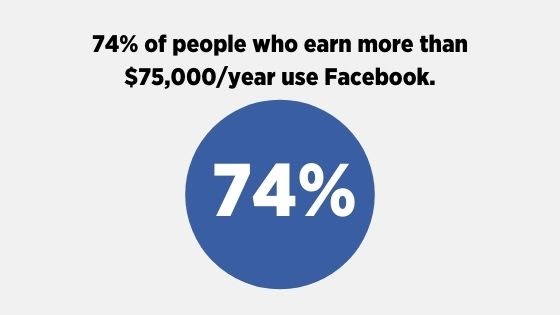
- 74% of people who earn more than $75,000/year use Facebook. (Pew Research Center)
- 74% of people with one or more college degrees use Facebook. (Pew Research Center)
- 73% of urban adults use Facebook. 69% of suburban and 66% of users are on the platform. (Pew Research Center)
Facebook ad statistics
- The average cost-per-click (CPC) across industries is $1.86. (Small Fit Business)
- The average cost-per-thousand-views (CPM) is $11.19. (Small Fit Business)
- According to OkDork, ads convert people to buyers at 0.1-0.2%. (OkDork)
- The average click-through rate (CTR) is 0.89%. (Small Fit Business)
- The average conversion rate (CR) is 7.75%. (Small Fit Business)
- That same OkDork test shows that ads convert to email subscribers at 20%.
- Adding stories to feed campaigns by using placement optimization can result in a 21% increase in brand lift. (Facebook)
- An experiment by AdEspresso showed that mobile ad placements outperform desktop ads by 45%. (AdEspresso)
- By adding a call to action (CTA) button to ads, clicks can increase 2.85x. (NextRoll)
- The top CTA button for click-throughs is “Learn more,” followed by “Shop now,” “Download,” “Sign up,” and “Book now.” (NextRoll)
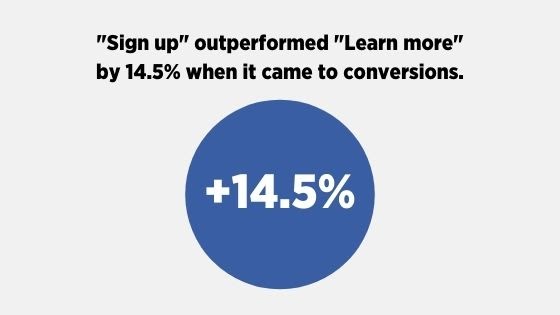
- However, according to an AdEspresso test, “Learn more” got a 22.5% higher click-through rate than “Sign up.” But “Sign up” outperformed “Learn more” by 14.5% when it came to conversions. (AdEspresso)
Facebook video statistics
- Video gets 59% more engagement than other post types. Video outperforms photos by 73%. (BuzzSumo)
- The optimal length of a Facebook video is between 3-5 minutes. (BuzzSumo)
- Out of 100 million videos, the most popular topic is food, followed by fashion and beauty, animals, DIY, and humor. (BuzzSumo)
- 65% of people in the US say they came across videos on Facebook spontaneously. (Facebook)
- 35% of users say they watch videos on Facebook multiple times per day. (Facebook)
- 65% of people surveyed say they watch videos on Facebook every day. (Facebook)
- 90% of people say they watch videos on Facebook to discover new points of interest.
- 94% of people surveyed in the US who watch a publisher video on Facebook report sharing it. (Facebook)
Facebook group statistics
- 1.4 billion people use Facebook groups. (Facebook)
- A survey of people aged 18-24 shows that users are happy to welcome brands into groups, as long as brands provide a genuine value exchange. (Facebook)
Facebook engagement statistics
- 73% of users use Facebook daily. (Statista)
- The average time users spend on Facebook during each visit is 6 minutes 23 seconds. (eMarketer)
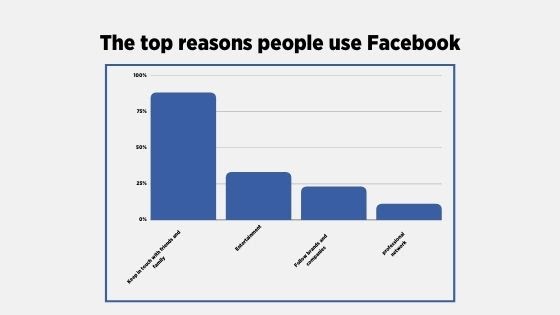
- The main reason people use Facebook is to keep in touch with friends and family (88%). On second place, people want to get entertainment (33%). 23% use the platform to get news and 17% use it to follow brands and companies. 11% use it to strengthen their professional network. (Statista)
- Based on 777 million posts, the most engaging content types on Facebook are: video, questions, photo, giveaway, links, and coupons (in that order). (BuzzSumo)
- The best times to post on Facebook is between 9pm-11pm EST. The best day to post is Sunday and the next best day is Saturday. (BuzzSumo)
- The optimal length of a Facebook post is no longer than 50 characters. (BuzzSumo)
- People share information on Facebook for five reasons. (NYT)
- Delight others with valuable & entertaining content
- Identify and present ourselves to others,
- Foster relationships,
- Self-fulfillment,
- Spreading the word about issues, products & brands
- An analysis of 100 million posts showed that using emotional phrases in headlines works best in driving engagement (for example: “give you goosebumps,” “is too cute,” and “can’t stop laughing”). Other engaging headlines evoke curiosity (“what happened next” and “top X ways to”, “this is why,” and “the reason to”). Quizzes and tribal headlines (“15 things only parents will know”) are also engaging Facebook audiences. (BuzzSumo)
- The worst performing headlines include words like: “control of your,” “your own business,” “work for you,” and “the introduction of.” (BuzzSumo)
Instagram Statistics
You know Instagram is getting bigger by the day, but you might not know just how powerful Instagram is for your marketing. Here’s what you need to know about Instagram, Instagram ads, using video on Instagram, and more.
- Instagram hosts more than one billion monthly active accounts. (Facebook)
- The US has the most Instagram users. (Statista)
- 37% of US adults use Instagram. (Pew Research Center)
- 31% of users are male and 43% are women. (Pew Research Center)
- 67% of 18-25-year-old US adults, 47% of 30-49 year-olds, 23% of 50-64 year-olds, and 8% of 65+ year-olds use Instagram. (Pew Research Center)
- 72% of US teens use Instagram. (Pew Research Center)
- 42% of people who make $75,000/year use Instagram. (Pew Research Center)
- 43% of people with at least one college degree use Instagram. (Pew Research Center)
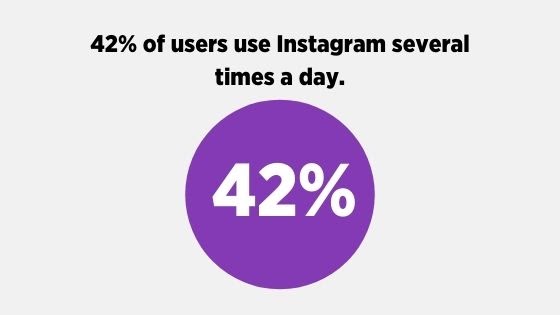
- 42% of users use Instagram several times a day. (Pew Research Center)
- 67% of 18-24 year-olds use Instagram multiple times per day. The next biggest age group are 25-34 year-olds (60%). (Facebook) <img>
Instagram ad statistics
- The average cost-per-click across Instagram is around $0.70-$0.80. (AdEspresso)
- Cost-per-click is slightly higher for women than for men. (AdEspresso)
- Tuesday and Wednesday seem to be the days with the highest cost-per-click. (AdEspresso)
- Instagram users want to see the following types of ads. (Instagram)
- Less than 15 seconds (36%)
- 15-30 seconds (32%)
- 30-60 seconds (24%)
- Relate to them (31%)
- Suited for the Instagram feed (31%)
- Suited for Instagram Stories (29%)
Instagram video statistics
- 500 million people watch Instagram Stories daily. (Instagram)
- The platform has seen an 80% increase in the time users spend watching video on the platform. (Instagram)
- More than 60% of Stories are sound-on. (Facebook)
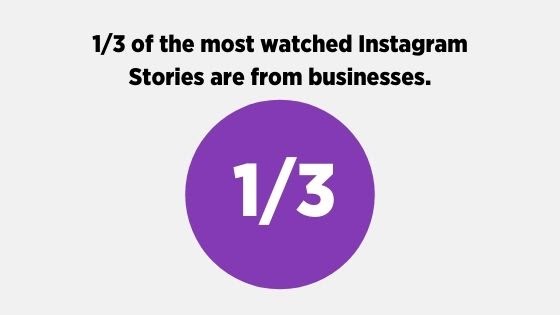
- One-third of the most viewed Stories on Instagram are from businesses. (Instagram)
- 19% of users watch Instagram Stories from the beginning to the end. (Mention)
- People use Instagram Stories to see what friends are doing at the moment and to see unfiltered, authentic content. They also watch stories to see playful and funny content. (Instagram)
Instagram engagement statistics
- Instagram’s median engagement rate is 1.6x (17x higher than Facebook posts). (Rival IQ)
- Image posts receive 27.55% more likes than permanent video posts and 13.55% more likes than carousel posts. (Mention)
- Image posts get the most comments. Video posts get the second-most comments and carousel posts come in on third place. (Mention)
- However, according to AdWeek, Instagram videos get 2x more engagement than posts. (AdWeek)
- Tagging 1-3 people in your posts will return the highest amount of likes and comments. (Mention)
- Including faces in a post gets 38% more likes than those without. (Georgia Tech)
- Posting more frequently on Instagram does not mean more engagement. (Rival IQ)
- Captions that are 1,000-2,000 characters long get the most engagement, followed by captions that are 500-1,000 characters long (includes hashtags). (Mention)
- The best time to post on Instagram is at 12pm in your local time. (Mention)
- Major brands post to Instagram an average of 1.5 every day. (Buffer)
- There doesn’t seem to be any connection between the number of hashtags used and engagement. (Mention)
- Posts with an average of 5.44 hashtags have high engagement. (Mention)
YouTube Statistics
How well does YouTube work? Here are data and numbers that show you who uses YouTube, how effective YouTube marketing is, and how well YouTube ads work.
- There are 2+ billion YouTube users. (YouTube) This makes Youtube the second largest search engine in the world.
- One billion hours are watched every day on YouTube. (YouTube)
- 73% of US adults use YouTube. (Pew Research Center)
- 16% of the site’s traffic comes from the US. (Alexa)
- On mobile alone, YouTube reaches more 18+-year old adults during prime time than any cable network during an average week. (Think With Google)
- 500 minutes of video are uploaded to YouTube every minute. (Statista)
- 32% of users use the platform every day (versus 49% who say they use it less often). (Pew Research Center)
- 25% of YouTube users say they use the site daily. 58% say they use it less often. (Pew Research Center)
- 78% of men in the US use YouTube, while 68% of women use the platform. (Pew Research Center)
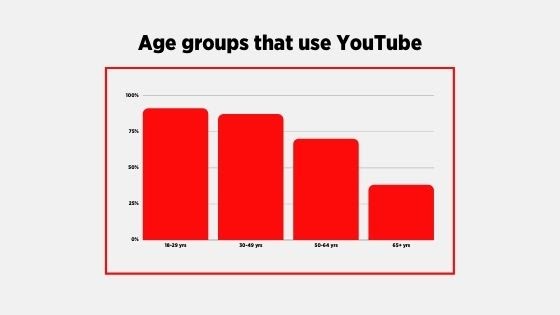
- 91% of US adults aged 18-29 use YouTube. 87% of people aged 30-49 and 70% of people aged 50-64 use it. Only 38% of people who are 65+ use YouTube. (Pew Research Center)
- 83% of people who make 75,000+/year use YouTube. (Pew Research Center)
YouTube ad statistics
- Customers of specific brands were 15% more pleasantly surprised when they saw more relevant ads based on better signals. (Think With Google)
- People who hadn’t considered a brand as a top choice were 21% more curious after having seen more relevant ads. (Think With Google)
- Fostering emotional connection by understanding underlying needs was 16% more important to brand love and trust. (Think With Google)
- 29% of marketers say that pre-roll (skippable) video ads are the most effective ads on YouTube. (PPC Hero)
YouTube engagement statistics
- Almost 4x as many people prefer watching video on YouTube as on less video-centric social media platforms. (Think With Google)
- YouTube site visitors spend, on average, 16 minutes and 22 seconds during each visit to the platform. (Alexa)
- 7/10 people watch videos horizontally when watching videos on their phones. (Think With Google)
- 3/4 adults watch YouTube at home on their phones. (Think With Google)
- On average, each visitor goes through 8.89 page views per visit. (Alexa)
- 10% of the most popular YouTube videos draw 79% of the views. (Pew Research Center)
- 81% of YouTube users say they at least occasionally watch the videos that the algorithm recommends to them. (Pew Research Center)
- YouTube confirms a number that’s close: 70% of the time people spend watching YouTube is based on the YouTube algorithm’s recommendations. (Cnet)
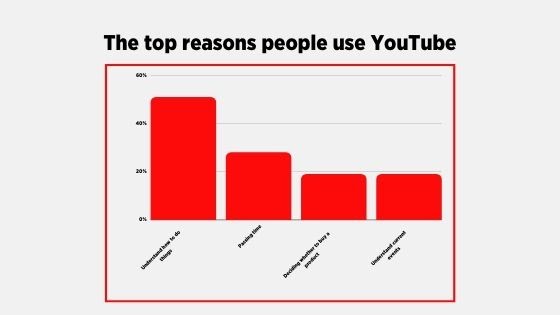
- Half of US adults who use YouTube say the site is very important for them to figure out how to do things they haven’t done before. (Pew Research Center)
- 51% say they’re using YouTube to figure out how things are done, 28% say they’re just passing time on YouTube, 19% say they use YouTube to decide whether to buy a product or not, and 19% use it to understand things that are happening in the world. (Pew Research Center)
- The most popular content categories are: comedy, music, entertainment/pop culture, and “how to.” (Think With Google)
- According to a study of 1.3 million YouTube videos, a video’s comment count, views, likes, shares, and quality (HD) strongly correlate with higher rankings. (Backlinko)
- The average length of a YouTube video that ranks on the first page is 14 minutes 50 seconds. (Backlinko)
- Keyword-rich video tags and an exact keyword match in the title have a small impact on rankings. However, keyword-optimized descriptions don’t seem to have any correlation with rankings. (Backlinko)
- Videos that feature children draw three times more engagement than other types of videos. (Pew Research Center)
- When people decide what to watch, relating to their passions is 3x more important than if the content features a famous actor and 1..6x more important than if the production is high quality. (Think With Google)
- A Google survey showed that 60% of YouTube users who had watched YouTube videos in the past 24 hours had watched something that related to their interests. (Think With Google)
- Between 2016-2018, watch time for “shop with me” videos grew 10x on mobile, “does it work” videos grew 12x, and “everything you need to know” video grew 2x on mobile. (Think With Google)
- 50,000 years of product review videos were watched on mobile between 2016-2018. (Think With Google)
- YouTube users are 3x more likely to prefer watching a YouTube tutorial video than reading the product’s instructions. (Think With Google)
- In 2018, 70% of millennial YouTube users watched YouTube to learn how to do something new or learn more about something they’re interested in. (Think With Google)
- 81% of parents find content on YouTube for their children. (Pew Research Center)
Pinterest Statistics
If you’re wondering about Pinterest and whether it will work for you, look no further. These statistics show you exactly who is using Pinterest and why and how effective Pinterest is at driving sales.
- Pinterest has 416 million monthly active users. (Statista)
- 28% of US adults use Pinterest. (Pew Research Center)
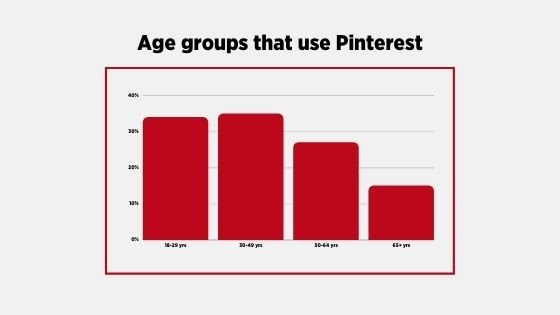
- 35% of people aged 30-49 use Pinterest. 34% of people aged 18-29 and 27% of people aged 50-64 use it. (Pew Research Center)
- Women are nearly three times as likely as men to use Pinterest (42% vs. 15%). (Pew Research Center)
- 41% of people who make $75,000/year use Pinterest, compared with 27% of those who make $30,000-$74,999 and 18% of those who make less than $30,000. (Pew Research Center)
- 38% of those with at least one college degree use the platform. (Pew Research Center)
- 30% of people who live in cities and 30% of people in the suburbs are Pinterest users. Of rural inhabitants, 26% use Pinterest. (Pew Research Center)
- Pinterest is the third-largest social media platform in the US. (NYT)
- 85% of pinners are on mobile. (Pinterest)
- 8/10 moms are pinners. (ComScore)
- However, 40% of US dads use Pinterest. (Pinterest)
Pinterest ad statistics
- The number of advertisers on Pinterest doubled in 2019. (Pinterest)
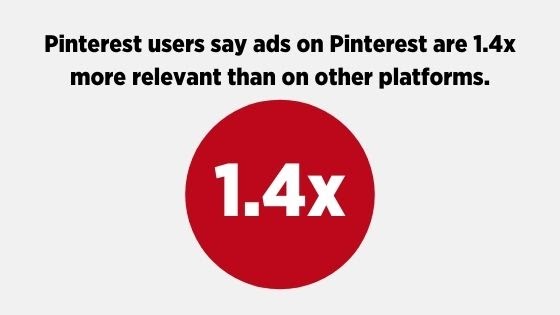
- The platform’s users say ads on Pinterest are 1.4x more relevant than on other platforms. (Pinterest)
Promoted pins that align with life moments and holidays get 22% more sales. (Pinterest)
Pinterest engagement statistics
- In 2018, there were 175 billion pins saved to 4 billion boards. (QZ)
- More than half of pinners who open Pinterest every month visit the platform every week. (QZ)
- Most of the engagement happens when people scroll through Related Pins on the platform. (QZ)
- The average pinner makes eight searches on the platform each month. That means that two billion searches happen on Pinterest every month. (QZ)
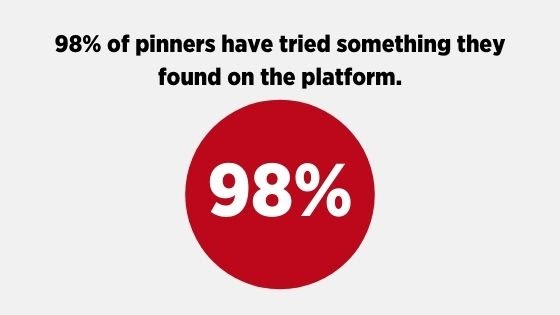
- 98% of pinners have tried something they found on the platform. (Pinterest)
- The longer a pin is published on Pinterest, the more engagement and impressions it gets. (Pinterest)
- 11pm is the most active time for pinning (6% of pinning happens then). (RJ Metrics)
- Searches on Pinterest Lens (Pinterest’s visual search tool) increased by 170% between 2017-2018. (Pinterest)
- The best-performing pins are beautiful, actionable, and interesting. (Pinterest)
LinkedIn Statistics
- The platform has 706 million users. (LinkedIn)
- 27% of US adults use LinkedIn. (Pew Research Center)
- The US is also the country with the largest audience size on the platform. (Statista)
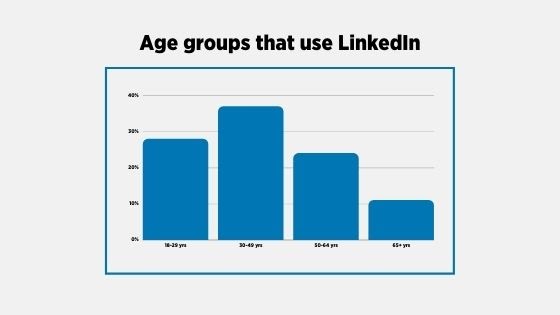
- 37% of people aged 30-49 use LinkedIn. 28% of people aged 18-29, 24% of people aged 50-64, and 11% of people aged 65+ use the platform. (Pew Research Center)
- 49% of people who make at least $75,000 are on LinkedIn. (Pew Research Center)
- 51% of people with at least one college degree are on the platform. (Pew Research Center)
- 180 million users are senior-level influencers, 63 million are decision-makers, and 10 million are C-level executives. (LinkedIn)
- There are 30 million companies on the social media platform. (LinkedIn)
LinkedIn ad statistics
- Cost-per-lead is 28% lower compared to Google Adwords. (LinkedIn)
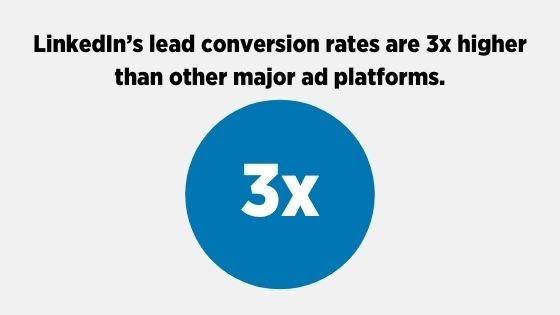
- The social media platform’s lead conversion rates are 3x higher than other major ad platforms. (LinkedIn)
LinkedIn engagement statistics
- Not very surprisingly, the main reason people are on LinkedIn is to strengthen their personal network. (Statista)
- Content shared on this social media platform was up nearly 50% year-over-year in June 2020. (LinkedIn)
- Since March 2020, livestreams have increased by 89%. (LinkedIn)
- In Q2 of 2020, sessions increased by 22% year-over-year. (LinkedIn)
- 57% of users use LinkedIn on mobile. (LinkedIn)
- Content on the platform gets 9 billion impressions. (LinkedIn)
- LinkedIn is 3x more trustworthy for delivering worthwhile content compared to other social media platforms. (LinkedIn)
- Sponsored InMail has a 52% open rate. (B2B Marketing)
- The platform is seen as the most trusted network. (Business Insider)
- The most engaging LinkedIn posts are published on Wednesdays between 8am-10am and noon, Thursdays at 9am and 1pm-2pm, and Friday at 9am. (Sprout Social)
Twitter Statistics
Does Twitter marketing work? If you’re wondering if/how Twitter marketing will result in sales, take a look at these studies and statistics. This is how well Twitter drives engagement and customers, if Twitter ads work, and how to use Twitter to grow your brand.
- Twitter has 330 million monthly active users. (Statista)
- 25% of Twitter users visit Twitter every day. (Pew Research Center)
- Twitter’s biggest audience is in the US. (Statista)
- 22% of US adults use Twitter. (Pew Research Center)
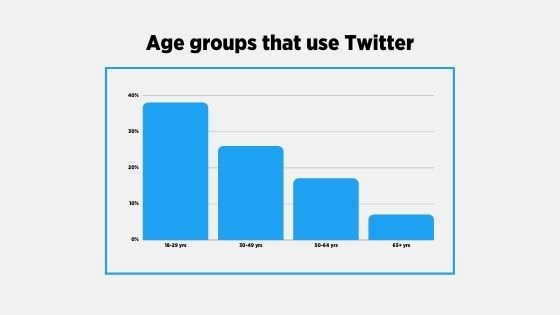
- 38% of those who are 18-29 years old use Twitter in the US. 26% of 30-49 year-olds, 17% of 50-64 year-olds, and 7% of 65+ year-olds use the platform. (Pew Research Center)
- 31% of those who make more than $75,000/year use Twitter. (Pew Research Center)
- 32% of people with at least one college degree use Twitter. (Pew Research Center)
- 26% of people in cities, 22% of people in suburbs, and 13% of people in rural areas use Twitter. (Pew Research Center)
Twitter ad statistics
- Twitter ad engagement increased by 23% in 2019. (Twitter)
- Cost-per-engagement decreased 12% in 2019. (Twitter)
- Twitter ads with video are 50% cheaper in cost-per-engagement. (Twitter)
- Twitter users spend 24% more time with ads from creators (influencers with a broad reach and artists) as opposed to directly from brands. (Twitter)
- People spend 26% more time viewing ads on Twitter than on other leading social media platforms. (Twitter)
Twitter engagement statistics
- According to Alexa, Twitter users spend, on average, 12 minutes 57 seconds in a single session on Twitter.
- According to Statista, this number is 3 minutes 53 seconds on mobile. (Statista)
- The leading reason people use Twitter is to get news. (Statista)
- The most followed Twitter user is Barack Obama. (Statista)
- 90% of Twitter video views happen on mobile. (Twitter)
- It is the leading platform for discovery with 79% saying they like to discover what’s new. (Twitter)
- Three in four say that they first look to Twitter users to learn more about a topic. (Twitter)
- The same survey shows that Twitter users are perceived as trustworthy, well-informed, generous, and intelligent. (Twitter)
Other Social Media Platforms
What about platforms like Snapchat and Reddit? Are they worth marketing on? Here’s a quick overview of what those platforms are all about.
Snapchat
- 24% of US adults use Snapchat. (Pew Research Center)
- 62% of 18-29 year-olds use Snapchat. At the same time, only 25% of people aged 30-49 use it. 9% of people aged 50-64 and 3% of people aged 65+ are on Snapchat. (Pew Research Center)
- 46% of Snapchat users visit Snapchat every day. (Pew Research Center)
- 22% of people who earn more than $75,000/year use Snapchat. (Only Reddit has a lower number of users in this demographic.) (Pew Research Center)
- As users on Snapchat are younger than on most other social media platforms, only 20% of those with at least one college degree use Snapchat. (Pew Research Center)
- 29% of people in cities use Snapchat and 20% of people in both suburban and rural areas use it. (Pew Research Center)
- 11% of US adults use Reddit. (Pew Research Center)
- There are almost 2x more men than women on the platform in the US (15% of US men use it versus only 8% of US women). (Pew Research Center)
- 22% of people aged 18-29, 14% of people aged 30-49, 6% of people aged 50-64, and 1% of people aged 65+ use Reddit. (Pew Research Center)
- 15% of people who make at least $75,000/year use the platform (the lowest rate out of all other social media platforms that Pew researched). (Pew Research Center)
- 15% of those with at least one college degree use the platform. (Pew Research Center)
- 13% of people in suburban areas are Redditors. That number is 11% in urban areas and 8% in rural areas. (Pew Research Center)
Social Media Buyer Behavior Statistics
Who converts to buyers on social media and why? These social media marketing statistics show you everything you need to know about reaching your customers on social media and the platforms that are most effective for your marketing efforts. Read on!
Facebook products
- 57% of brands believe stories across Facebook’s products (Facebook, Instagram, and WhatsApp) are “somewhat effective” or “very effective.” (Buffer)
- 38% of people surveyed have talked to someone about a product or service after seeing it in stories. (Facebook)
- 31% of people surveyed have gone to a shop to buy a product or service after seeing it in stories. (Facebook)
- People said that they’re most interested in seeing stories from brands that are: (Facebook)
- Quick and easy to understand: 52%
- Feature sales and promotions: 50%
- Introduce new products: 47%
- Feel real: 46%
- Offer tips and advice: 46%
- 58% of people surveyed say that they have browsed a brand’s website to get more information after seeing a product or service in stories. (Facebook)
- One in two people surveyed says that they have visited a website to buy a product or service as a result of seeing it in stories. (Facebook)
- One in three or 39% of Instagram users says they are more interested in a brand or product after having seen it in Instagram Stories. (Instagram)
- People say that Instagram Stories bring them closer to brands. (Instagram)
- 200 million+ Instagram users visit at least one business profile every day. (Instagram)
- 80% of Instagram users follow at least one business. (Instagram)
- Over 150 million Instagram users use Instagram Direct to communicate with a business every month. (Instagram)
- According to a Facebook survey, 79% of users say they search for more information after having seen a product or service on Instagram. (Facebook)
- The same survey shows that 65% visit the brand’s website or app after seeing a product or service. (Facebook)
- 46% made a purchase after seeing an Instagram post about a product or a service. (Facebook)
- Similarly, 37% visited a retail shop. (Facebook)
- And 31% followed the brand’s account online. (Facebook)
- 29% talked to someone about it. (Facebook)
- 54% of people say that they made a purchase either in the moment or after seeing a product or service on Instagram. (Facebook)
- A Facebook survey shows that 83% say they discover new products or services on Instagram. (Facebook)
- Instagram itself puts that number at 60%. (Instagram)
- 81% of Instagram users research products or services on the platform. (Facebook)
- That same survey showed that 80% decide whether to buy a service or product. (Facebook)
- 42% say Instagram content can help them discover products or services. (Facebook)
- 44% say Instagram content can help them find new information about a product or service. (Facebook)
- 41% say that brand content on Instagram helps them research a product or service. (Facebook)
YouTube
- Watch time for YouTube videos on “which product to buy” doubled between 2017and 2018. (Think With Google)
- 80% of people who said they watched a YouTube video about a product they were planning to buy did it at the beginning of their shopping process. (Think With Google)
- 19% of YouTube users use it to decide whether to buy a product or not. (Pew Research Center)
- Over 90% of people around the world say they discover brands and products on YouTube. (Think With Google)
- 70% of shoppers say they are open to learning about products from brands on YouTube. (Think With Google)
- Almost two-thirds of shoppers say online video has given them ideas and inspiration for their purchase. (Think With Google)
- 40% of global shoppers say they have purchased products they discovered on YouTube. (Think With Google)
- 90% of weekly pinners make purchase decisions on Pinterest. (Pinterest)
- The average pinner spends 29% more than other households. (QZ)
- 78% of pinners think that content from brands is useful. (Pinterest)
- A 2019 survey by Pinterest shows that three-quarters of pinners are “very interested” in new products. (Pinterest)
- 77% of weekly pinners say they discover new brands on Pinterest. (Pinterest)
- 83% of pinners have made a purchase based on brand content. (Pinterest)
- 48% of pinners see shopping and finding new products as a priority (compared with 4-14% on other platforms) (eMarketer) <img>
- Pins that show a product or service in action get 67% more sales. (Pinterest)
- The average order value of sales that come from Pinterest is $50. (9% higher than on Facebook). (Shopify)
- LinkedIn is rated the #1 platform for B2B lead generation. (LinkedIn)
- 89% of B2B marketers use it to get leads. (LinkedIn)
- 4 out of 5 LinkedIn members drive business decisions. (LinkedIn)
- It’s audience has 2x the buying power of the average web audience. (LinkedIn)
- In a survey by Twitter, half of those surveyed said that a Twitter user made them aware of new brands and products. (Twitter)
- One in two said that Twitter users helped them become more familiar with different aspects of a product. (Twitter)
- Nine in ten said they changed their opinion about a purchase because of the advice they received from someone they knew on Twitter. (Twitter)
- 60% of Twitter users like more inclusive brands. (Magna/IPG Media Lab/Twitter)
- 53% of people on Twitter are more likely to be the first to buy a new product. (Twitter)
Over to you!
There you have it. Now you have the 200+ most important social media marketing statistics.
I’d love to hear from you:
Is there a statistic here that surprised you?
If yes, let me know in the comments below.